Experimental Techniques used to measure the size and concentration of catalyst nanoparticles associated with the direct spinning of CNT aerogels
This document is intended to provide accessible explanations regarding the experimental techniques used to generate the aerosol-related results in the poster "Fundamental parameters for direct-spinning of carbon nanotube aerogels" presented at NT19. The descriptions are based on sections of the experimental work in the following three papers:
[1] Hoecker C, Smail F, Bajada M, Pick M, Boies A. Catalyst nanoparticle growth dynamics and their influence on product morphology in a CVD process for continuous carbon nanotube synthesis. Carbon N Y 2016;96:116–24. doi:10.1016/j.carbon.2015.09.050.
[2] Hoecker C, Smail F, Pick M, Weller L, Boies A. The Dependence of CNT Aerogel Synthesis on Sulfur-driven Nucleation Processes and a Critical Catalyst Particle Mass Concentration. Sci Rep 2017;7:14519–1. doi:10.1038/s41598-017-14775-1.
[3] Hoecker C, Smail F, Pick M, Boies A. The influence of carbon source and catalyst nanoparticles on CVD synthesis of CNT aerogel. Chem Eng J 2017;314:388–95. doi:10.1016/j.cej.2016.11.157.
CNTs formed in the direct spinning process are synthesised from an aerosol of iron-sulfur based catalyst nanoparticles. Characterisation of these particles has lead to new insights into the factors driving the direct-spinning process.
The in situ particle measurement experiments described in the poster "Fundamental parameters for direct-spinning of carbon nanotube aerogels" were carried out in an alumina horizontal tube furnace (50 mm outer diameter, 40 mm inner diameter) at ambient pressure. A schematic of the setup is shown in Figure 1.
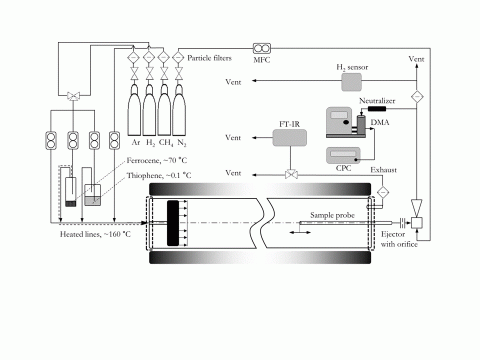
Figure 1 Schematic of the experimental setup using a shower-head injector to achieve a uniform inflow and a ceramic sample probe (3 mm outer diameter) to measure in-situ catalyst particle size distributions .
The reactor shows a typical temperature and flow profile as shown in Figure 2.
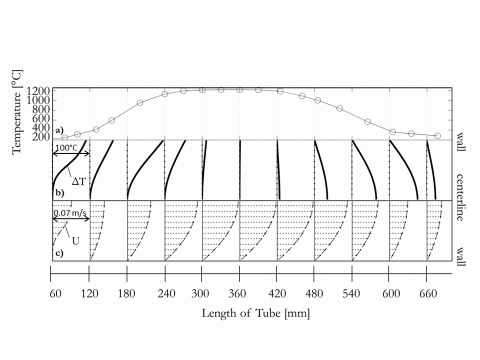
Figure 2 Flow and temperature profiles along the reactor axis, both measured and simulated for a hydrogen bulk flow of 0.5 slpm, a furnace set point of 1200°C and a radially uniform inflow into the reactor 50 mm from the reactor entrance; a) measured wall temperature in the reactor, b) modelled temperature gradients between wall and centerline with ΔTmax ~ 98°C, c) simulated velocity profiles in the reactor with Umax ~ 0.068 m/s.
Equipment for aerosol particle measurement
Particle measurements were carried out using a TSI-Scanning Mobility Particle Sizer 3080 (SMPS) system. This equipment consists of 3 components:
A Differential Mobility Analyzer (DMA, e.g. TSI 3081 or 3085)
This is essentially a metal cylinder with a high voltage electrode running through its length. The sampled particles are injected into a controlled laminar gas flow (a 'sheath flow') and travel along the cylinder length where they are subjected to a varying electrical field. The particles are sorted based on their aerodynamic diameter and the electrostatic force they experience, with only specific sizes making their way out of the DMA column for a particular applied voltage. This is illustrated in Figure 3
An Electrostatic Classifier (EC, e.g. TSI 3080 or 3082)
This unit controls the sheath flow and applied voltage supplied to the DMA. It also contains a particle charge neutralizer (either an Xray source or radiation source). The neutralizer does not in reality remove all charges from the nanoparticles, but instead makes sure the sample has a net charge of zero. This makes sure that the sample will respond in the way expected to the electrical field it experiences in the DMA (basically, the neutralizer sorts out the raw sample so it can be analysed effectively).
This source provides a fuller explanation of an SMPS: http://www.cas.manchester.ac.uk/restools/instruments/aerosol/scanning/
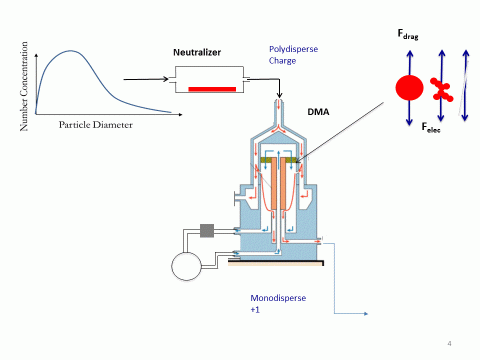
Figure 3. A particle size distribution is sampled, neutralised and fed into a DMA where the particles are size-sorted based on their aerodynamic diameter and the electrostatic force they experience in the applied voltage. A monodispersed sample passes out of the DMA for each applied voltage
A Condensation Particle Counter (CPC, e.g. TSI 3776)
This takes the sorted nanoparticles from the DMA and counts them. It contains a saturation chamber filled with n-butanol vapour. The n-butanol vapour condenses on the nanoparticles, increasing their diameter sufficiently so they can be detected and counted via a laser and light-scattering photodiode detector. The CPC contains a pump which controls the flow rate of the sample. This allows the reporting of particle concentrations (count per unit volume)
This website provides a good explanation of how a CPC works: http://www.cas.manchester.ac.uk/restools/instruments/aerosol/cpc/and a sketch is shown in Figure 4.
Software associated with the SMPS system takes the raw data of applied voltage and particle counts to processes this to produce particle size distribution data. The user can then correct the data output for sample dilution ratios (see 'Aerosol particle sampling' below) diffusion losses and thermophoretic losses inside the sampling probe, to gain accurate data on the particle concentrations and sizes inside the reactor.
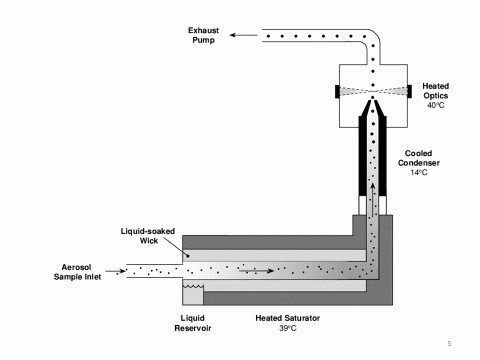
Figure 4 Condensation particle counter, showing the aerosol sample (coming from the DMA) entering on the left, running through the n-butanol vapour filled saturator and condenser and then the optical cell where the particles are counted
Aerosol particle sampling
It is important to dilute samples as rapidly as possible so that they do not continue to evolve in size between sampling and analysis. In our set-up, particles were sucked out of the reactor via a 3mm diameter ceramic tube, where an ejector-diluter, combined with a critical orifice (0.04 mm diameter) was used to provide the suction.
An ejector-dilutor works using the venture effect; purified pressurised dilution gas flows at high speed around an ejector nozzle and causes a pressure drop which draws the sample into the diluter through a nozzle (e.g. a critical orifice). The raw sample is instantaneously diluted as it mixes with the dilution airflow always providing a homogeneous and stable sample (figure below)
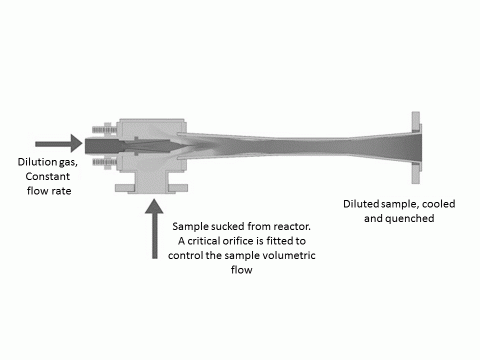
Figure 5 Ejector-dilutor
In our experiments, N2 was used as the dilution gas as the catalyst particle sample gas was H2. It is important to dilute the sample to below the lower explosion limit of H2 so that the sample does not pose a risk to the SMPS equipment (mixing a flammable gas with a high voltage, where there might be the possibility of arc discharge is not a good idea!).
Use of a critical orifice with the ejector-dilutor allows control of the sample volume, while use of a narrow, small internal volume, sampling probe means that the particles travel at high velocity out of the reactor environment once sampled. We typically sampled 300 sccm from a total reactor flow of 500-550 sccm.
The location of the 3mm probe is adjustable and could be altered during the experiment so that particle samples could be collected along the axis of the reactor tube.
Supply of chemical precursors
We used ferrocene (Acros, purity 98%) and thiophene (Sigma Aldrich, purity 99%) as precursors for the catalyst nanoparticles, in molar ratios typically used in our direct-spinning experiments. This meant that they were supplied at concentrations of 0.5 mass% and ~3.0 mass% in H2, with a H2 carrier flow rate of typically 500 sccm.
The precursors were supplied to the reactor through a showerhead injector which ensured a uniform and laminar inflow with a typical Reynolds number Re~25 (<<2300, where flow instabilities would become apparent) at the inlet. All flow rates were controlled by mass flow controllers (Alicat). The injector face was placed ~50 mm from the inlet of the furnace tube such that the reactants entered the reactor space at approximately 200 C.
SEM study of aerogel material: Experimental Techniques used "freeze" the synthesis of CNT aerogel and map SEM features of the aerogel with particle size distributions along the furnace axis
The photograph below shows a quartz reactor tube containing a CNT aerogel synthesised from ferrocene, thiophene and CH4, supplied in the ratios used for direct spinning with the reactor heated to 1200 °C. The flow direction through the reactor was from left to right. The picture (Figure 6) shows a thin thread of CNT aerogel material running down the length of the reactor, with a macroscopic CNT aerogel in the exit zone. The reaction was carried out in a 700 mm long quartz tube so that it matched up with the 700 mm long alumina tube used for the particle measurements.
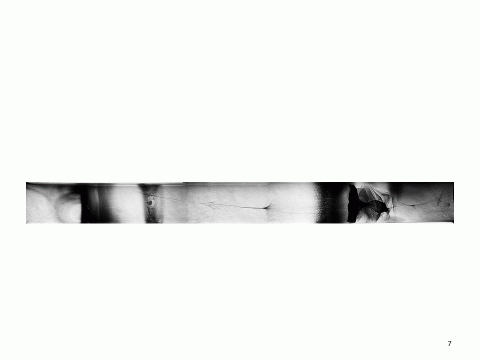
Figure 6 Picture of quartz reactor tube, where the left hand side is the reactor inlet and right hand side is the outlet. Macroscopic formation of CNT aerogel material occurs towards the end of the reactor. There is a very fine thread of CNT material running down the length of the reactor tube
Ferrocene, thiophene and CH4, using H2 as a carrier gas, were injected into the quartz reactor tube (reactor set point 1200 °C) in the correct ratios for direct spinning. As soon as CNT aerogel formation was observed in the exit zone, the reactants were switched off and the gas flow replaced with Ar. The reactor was then left to cool.
Once cool, the reactor tube was removed from the furnace and CNT material samples were carefully manually extracted, recording their axial locations. SEM analysis of the samples showed trends which matched up with the catalyst particle size distribution behaviours, shown in Figure 7.
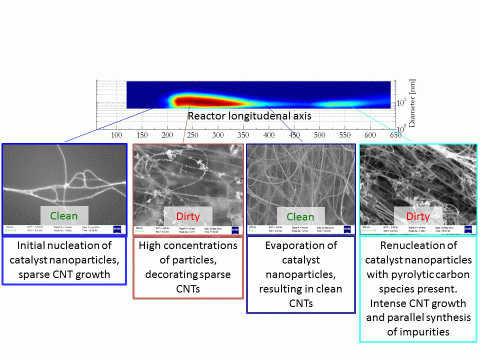
Figure 7 Figure shows the relationship between the axial catalyst nanoparticle size distribution and features observed in the SEM analysis of CNT material along the reactor axis
Experimental Techniques used to measure the effect of sulphur on catalyst particle nucleation
To study the effects of S on the catalyst nucleation processes, measurements conducted using the aerosol particle measurement techniques described above and an alumina horizontal tube furnace (700 mm × 40 mm ID).
In one set of experiments, only ferrocene in hydrogen was fed into the furnace tube, with the ferrocene being supplied in a suitable quantity for a small amount of CNT aerogel formation. Only low concentrations of catalyst particles were detected using the SMPS.
In the next set of experiments, thiophene was added with the ferrocene. This time, catalyst nanoparticles were detected in much higher concentrations.
In the first part of the reactor, catalyst nanoparticles were detected at lower temperatures (~800 °C compared to ~1050 °C)
In the last part of the reactor, re-nucleated catalyst nanoparticles were detected at higher temperatures (~800 °C compared to ~550 °C)
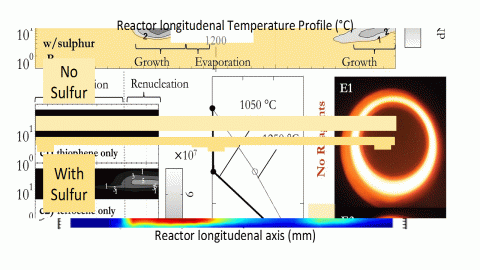
While the role of sulfur as a CNT-growth promoter has been widely discussed in CNT literature, aerosol sampling techniques have allowed us to identify an additional role in aiding the catalyst nanoparticle nucleation.
In other aerosol systems, sulphur is known to lower the Gibbs Free Energy barrier associated with the stability of a critical cluster size (the number of atoms which need to cluster together to form a stable particle nucleus) but this work is the first time this effect has been observed in a FC-CVD system.
Particle nucleation occurs when a vapour reaches super-saturation – in our system, a supersaturated iron vapour in H2. The lowering of the Gibbs Free Energy barrier means that the iron-based catalyst nanoparticles can initially nucleate from a vapour phase with a lower level of Fe saturation (ie at lower temperature) and then, after evaporation in the hottest region of the furnace, re-nucleate at a higher temperature
(for more information on classical nucleation theory and the Gibbs Free Energy barrier, see Hoecker C, Smail F, Pick M, Weller L, Boies A. The Dependence of CNT Aerogel Synthesis on Sulfur-driven Nucleation Processes and a Critical Catalyst Particle Mass Concentration. Sci Rep 2017;7:14519–1. doi:10.1038/s41598-017-14775-1)
Experimental Techniques used to identify the role of Pyrolytic Carbon compounds in the direct spinning of CNT aerogels
When we realised that catalyst particle renucleation, in the last portion of the reactor, was causing the CNT aerogel formation, the assumption was that if the hydrocarbon precursor was supplied to this location in the reactor, then CNT aerogel would be efficiently made.
To test the theory the reactor was set up as shown in Figure 8
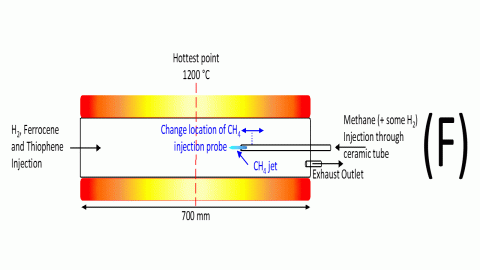
Figure 8 Experiments with counterflow CH4
Ferrocene, thiophene and H2 were fed in the front end of a quartz reactor tube as normal. Methane (CH4) was injected counterflow to the other reactants, through a thin ceramic tube. Thr position of the ceramic tube was adjustable, it could be pushed deeper into the reactor, or pulled back.
Fluid dynamics calculations were carried out to calculate how far the resulting CH4 jet would reach beyond the end of the supply tube and the supply tube was initially positioned so that the jet would reach the axial reactor position where the catalyst particle renucleation occurred.
The flows of ferrocene, thiophene and H2 were started and CH4 was supplied after ~5 minutes. Visual observations were made at the end of the quartz tube to see if CNT aerogel was forming.
With the CH4 jet only reaching the catalyst renucleation zone, no CNT aerogel formed. Only when the CH4 supply tube was positioned so that the CH4 jet reached the central zone of the reactor (at 1200 °C) was CNT aerogel formation observed at the end of the reactor as shown in the schematic in Figure 9.
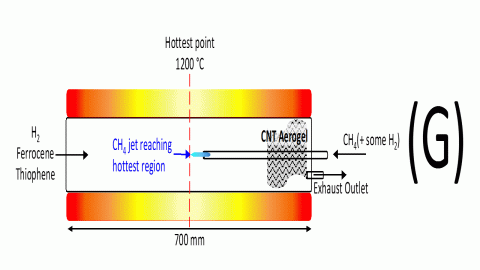
Figure 9 CNT aerogel formation occurring when CH4 jet reaches the hottest zone of the reactor